多导睡眠图是实验室评估睡眠的主要工具,可用于临床和研究目的。多导睡眠图检查期间,采用脑电图和其他传感器将睡眠分为明确的几个阶段。最初的睡眠分期出现在20世纪30年代,1968年首次发布了对睡眠进行分期的正式规则[2]。自2007年以来,大多数睡眠实验室使用来自美国睡眠医学学会(American Academy of Sleep Medicine, AASM)睡眠和相关事件判读手册的术语和判读规则,该手册会常规更新[3]。AASM认证的睡眠实验室被要求采用AASM判读手册,全世界正越来越多地采纳这些指南[4]。
Siegel JM. Sleep viewed as a state of adaptive inactivity. Nat Rev Neurosci 2009; 10:747.
Rechtshaffen A, Kales A (Eds). A manual of standardized terminology and scoring system for sleep stages of human subjects. 204, United States Government Printing Office; National Institutes of Health, Washington, DC 1968.
Berry RB, Brooks R, Gamaldo CE, et al. The AASM Manual for the Scoring of Sleep and Associated Events: Rules, Terminology and Technical Specifications, 2nd ed, American Academy of Sleep Medicine, Darien 2014.
Magalang UJ, Chen NH, Cistulli PA, et al. Agreement in the scoring of respiratory events and sleep among international sleep centers. Sleep 2013; 36:591.
Ohayon MM, Carskadon MA, Guilleminault C, Vitiello MV. Meta-analysis of quantitative sleep parameters from childhood to old age in healthy individuals: developing normative sleep values across the human lifespan. Sleep 2004; 27:1255.
Agnew HW Jr, Webb WB, Williams RL. The first night effect: an EEG study of sleep. Psychophysiology 1966; 2:263.
Proctor A, Bianchi MT. Clinical pharmacology in sleep medicine. ISRN Pharmacol 2012; 2012:914168.
ASERINSKY E, KLEITMAN N. Regularly occurring periods of eye motility, and concomitant phenomena, during sleep. Science 1953; 118:273.
Tononi G, Cirelli C. Perchance to prune. During sleep, the brain weakens the connections among nerve cells, apparently conserving energy and, paradoxically, aiding memory. Sci Am 2013; 309:34.
American Academy of Sleep Medicine. International classification of sleep disorders: Diagnostic and coding manual, 2nd ed, Westchester, IL 2005.
Weitzenblum E, Chaouat A. Sleep and chronic obstructive pulmonary disease. Sleep Med Rev 2004; 8:281.
Howell MJ. Parasomnias: an updated review. Neurotherapeutics 2012; 9:753.
España RA, Scammell TE. Sleep neurobiology from a clinical perspective. Sleep 2011; 34:845.
Anderson KN, Bradley AJ. Sleep disturbance in mental health problems and neurodegenerative disease. Nat Sci Sleep 2013; 5:61.
Porkka-Heiskanen T, Zitting KM, Wigren HK. Sleep, its regulation and possible mechanisms of sleep disturbances. Acta Physiol (Oxf) 2013; 208:311.
Xie L, Kang H, Xu Q, et al. Sleep drives metabolite clearance from the adult brain. Science 2013; 342:373.
Yang G, Lai CS, Cichon J, et al. Sleep promotes branch-specific formation of dendritic spines after learning. Science 2014; 344:1173.
Siegel JM. Clues to the functions of mammalian sleep. Nature 2005; 437:1264.
Tononi G, Cirelli C. Sleep and the price of plasticity: from synaptic and cellular homeostasis to memory consolidation and integration. Neuron 2014; 81:12.
专题 7710 版本 18.0.zh-Hans.1.0
图表
Stage wake
This image demonstrates a 30-second recording (Compumedics) of stage wake with eyes closed, notable for the alpha activity occurring the occipital leads (labeled O2-M1 and O1-M2). The top two leads represent the eyes (right and left), the next lead is the chin, then the following six leads are EEG (right and left frontal, central, and occipital), ECG with heart rate below (R-R), and the leg EMG lead.
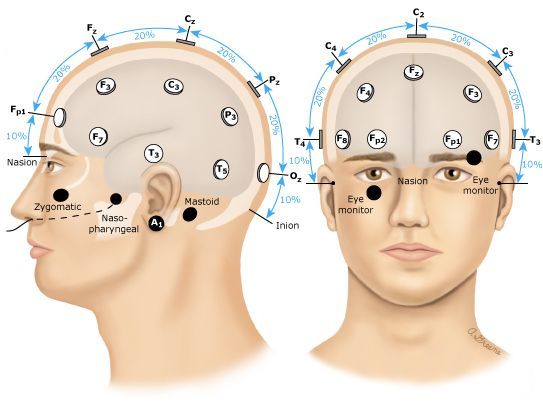
The location of electrodes for recording electroencephalograms from the scalp, nasopharyngeal, and external ear sites are shown. The leads placed on the zygomatic arch beneath the eye allow for monitoring of eye movements.
Adapted from: Jasper HH. Report of the committee on methods of clinical examination in electroencephalography: 1957. Electroencephalogr Clin Neurophysiol 1958; 10:370.
Graphic 78990 Version 2.0
Electroencephalography pattern labels and associated frequencies
EEG pattern
Stage N1 sleep
This image demonstrates a 30-second recording (Compumedics) of stage N1 sleep, notable for the theta activity throughout the first three quarters of the epoch. An arousal occurs at that time (arrow), with a return of alpha activity. The top two leads represent the eyes (right and left), the next lead is the chin, then the following six leads are EEG (right and left frontal, central, and occipital), ECG with heart rate below (R-R), and the leg EMG lead.
This image demonstrates a 30-second recording (Compumedics) of stage N2 sleep. Most notable is the beta-frequency spindle activity (dashed box), maximally seen in the central EEG leads. The top two leads represent the eyes (right and left), the next lead is the chin, then the following six leads are EEG (right and left frontal, central, and occipital), ECG with heart rate below (R-R), and the leg EMG lead.
This image demonstrates a 30-second recording (Compumedics) of stage N2 sleep. Most notable are the K-complexes (dashed boxes), maximally seen in the frontal and central EEG leads. The top two leads represent the eyes (right and left), the next lead is the chin, then the following six leads are EEG (right and left frontal, central, and occipital), ECG with heart rate below (R-R), and the leg EMG lead.
This image demonstrates a 30-second recording (Compumedics) of stage N3 sleep. Most notable are the delta waves throughout the EEG recording (background shading), maximal in the frontal leads. The top two leads represent the eyes (right and left), the next lead is the chin, then the following six leads are EEG (right and left frontal, central, and occipital), ECG with heart rate below (R-R), and the leg EMG lead.
This image demonstrates a 30-second recording (Compumedics) of stage R sleep. Most notable is the cluster of rapid eye movements noted in the eye leads (background shading). The top two leads represent the eyes (right and left), the next lead is the chin, then the following six leads are EEG (right and left frontal, central, and occipital), ECG with heart rate below (R-R), and the leg EMG lead.
This image demonstrates a 30-second recording (Compumedics) of stage R sleep. Most notable is the absence of rapid eye movements noted in the eye leads (labeled E2-M2 and E1-M2) or phasic EMG activity. The top two leads represent the eyes (right and left), the next lead is the chin, then the following six leads are EEG (right and left frontal, central, and occipital), ECG with heart rate below (R-R), and the leg EMG lead.
This image demonstrates a 30-second recording (Compumedics) of stage N2 sleep. Most notable is the arousal that occurs at the solid arrow, with a switch from theta EEG activity to alpha EEG activity. The top two leads represent the eyes (right and left), the next lead is the chin, then the following six leads are EEG (right and left frontal, central, and occipital), ECG with heart rate below (R-R), and the leg EMG lead.
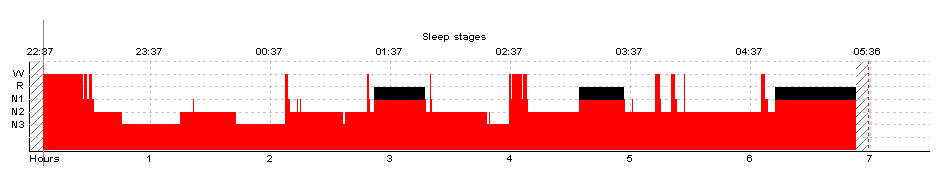
Hypnogram of a 36-year-old man in a sleep laboratory
This hypnogram represents the movement of a patient through various sleep cycles over the course of a single night; from approximately 10:37 pm to 5:36 am. The stages are listed as W (wake), R (REM sleep, stage R), and N1-N3 (NREM stages N1, N2, and N3). The patient starts by transitioning from wake into light NREM sleep, then to deep NREM sleep, back to light NREM sleep and then into REM sleep. This pattern generally repeats itself with blocks of NREM and REM sleep approximately every 90 minutes.
REM: rapid eye movement; NREM: non-REM.
Graphic 95157 Version 5.0
Graphic representation of the changes of sleep as humans age
Age-related trends for stage 1 sleep, stage 2 sleep, slow wave sleep, rapid eye movement sleep, wake after sleep onset, and sleep latency (in minutes).
WASO: wake after sleep onset; REM: rapid eye movement; SWS: slow wave sleep.
Republished with permission of Associated Professional Sleep Societies, LLC, from Meta-analysis of quantitative sleep parameters from childhood to old age in healthy individuals: developing normative sleep values across the human lifespan, Ohayon MM, Carskadon MA, Guilleminault C, Vitiello MV, Sleep 2004; 27:1255; permission conveyed through Copyright Clearance Center, Inc.
Graphic 103345 Version 1.0
Physiologic effects of sleep stage
NREM sleep
REM sleep
Autonomic nervous system
Increased parasympathetic tone
Unstable, brief surges in sympathetic and parasympathetic activity
Cardiovascular system
Heart rate is slow and regular
Blood pressure is lower
Heart rate is irregular
Transient increases in blood pressure
Respiratory system
Mild decrease in ventilatory drive in response to hypoxia and hypercapnia
Decreased respiratory rate
Significant decrease in ventilatory drive in response to hypoxia and hypercapnia
Increased respiratory rate
Temperature regulation
Decreased hypothalamic temperature set point
Reduced thermoregulatory mechanisms
Reproductive system
Penile erections
Increased vaginal blood flow
Dreaming
Less vivid
More vivid, visually intense
REM: rapid eye movement; NREM: non-REM.
Data from: Benca R. Sleep Disorders: The Clinician's Guide to Diagnosis and Management. Oxford University Press, New York. 2012.